Catch price drift before margins disappear
Every ingredient price change is recorded — when it happened, by how much, and from which supplier. Spot trends before they become problems.
Price drift is invisible until margins are already gone
A supplier quietly bumps cream cheese 8%. Olive oil creeps up 3% a month for six months. By the time you notice, your margins have been wrong for weeks.
- Small price increases go unnoticed until they compound
- No data to tell if a supplier's prices are trending up
- No record of when prices changed or by how much
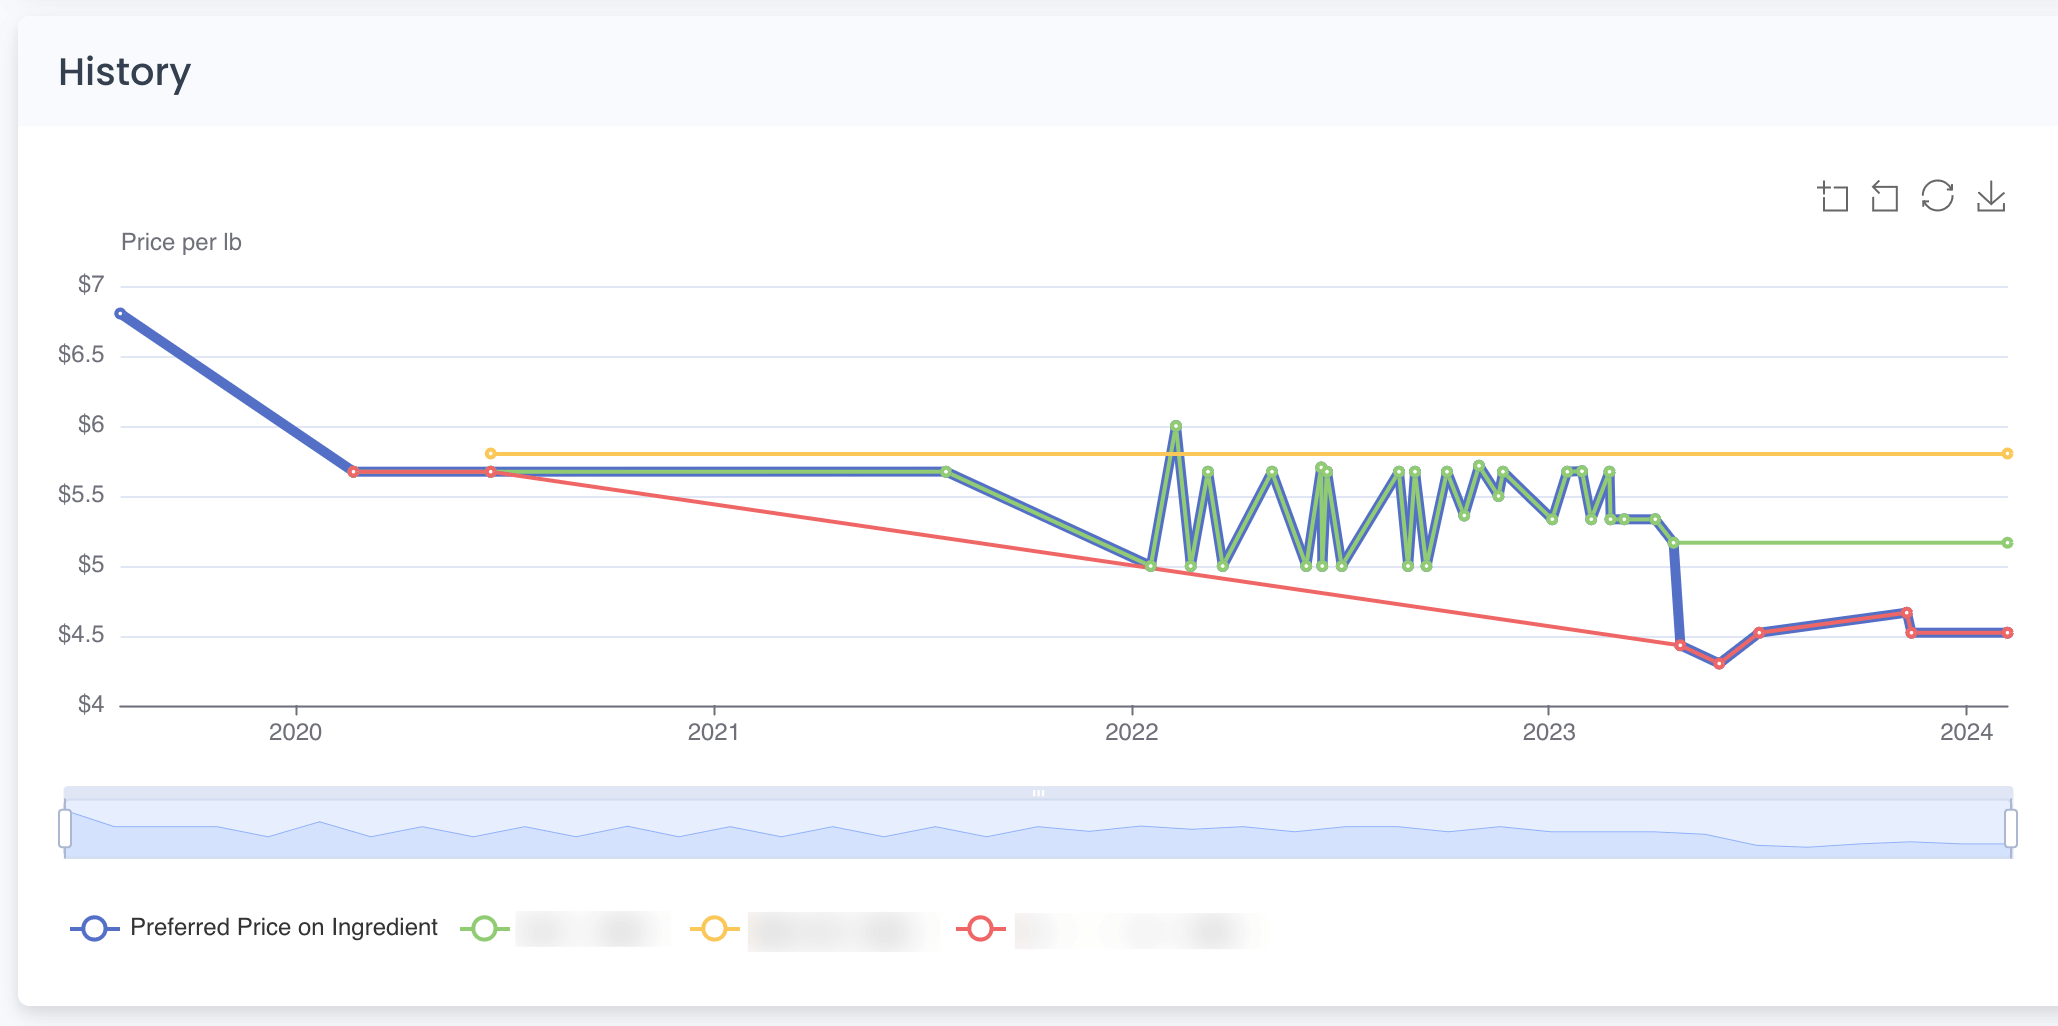
Price history turns invisible drift into visible trends you can act on.
Every time an ingredient price changes in Recipe Cost Calculator — whether from an invoice upload, a manual update, or a supplier switch — it's recorded. You can see the full price history for any ingredient: when it changed, by how much, and from which supplier.
The percentage change view makes it easy to spot which ingredients have moved the most. If your butter is up 20% over six months, that's worth knowing — especially if it's in half your recipes.
What you get
Full price history
View every change, every supplier, every date for any ingredient.
Percentage change view
See how much each ingredient has changed — a $0.50 increase means different things on a $5 vs. $50 item.
Negotiate with data
Walk into supplier meetings with a clear picture of how their prices have moved.
How it works
Prices are tracked automatically
Every price change — from an invoice, manual update, or supplier switch — is recorded with date and source.
View history per ingredient
Open any ingredient and see its full price timeline across all suppliers.
Spot trends and act
Use percentage change views to catch gradual increases and negotiate better.
Tracking prices vs. hoping for the best
| The old way | With RCC |
|---|---|
| No idea if an ingredient costs more than 3 months ago | Full price history with dates, amounts, and sources |
| Supplier says 'prices went up' — you have no counter-data | Show them exactly how their prices moved over time |
| Margin erosion from gradual price creep goes unnoticed | Percentage change view highlights drift immediately |
Price history is available per ingredient and per supplier, so you can compare how different suppliers' pricing has changed over the same period. This is really helpful during supplier negotiations or when deciding whether to switch suppliers for a particular item.
Why this matters
See the trends, not just the numbers.
Individual price changes are easy to miss. But when you can see the trend over months — this ingredient is steadily climbing, this supplier's prices have been stable — you make better purchasing decisions. It's the kind of visibility that spreadsheets can technically provide but nobody ever has time to build.
Frequently asked questions
Stop guessing what your ingredients cost last month
Price history is built into every ingredient. Start tracking today.