Stop guessing where the money goes
See proteins, produce, packaging, and labour broken down by recipe — instantly. Spot margin leaks before they compound.
You can't fix costs you can't see
A list of 20 ingredient prices tells you nothing about where the money actually sits. Without a category breakdown, rising protein or packaging costs stay invisible until margins shrink.
- No visibility into which categories drive recipe cost
- Rising category costs hide inside flat ingredient lists
- Comparing cost structures across recipes means manual math
Category breakdowns turn raw numbers into decisions you can act on today.
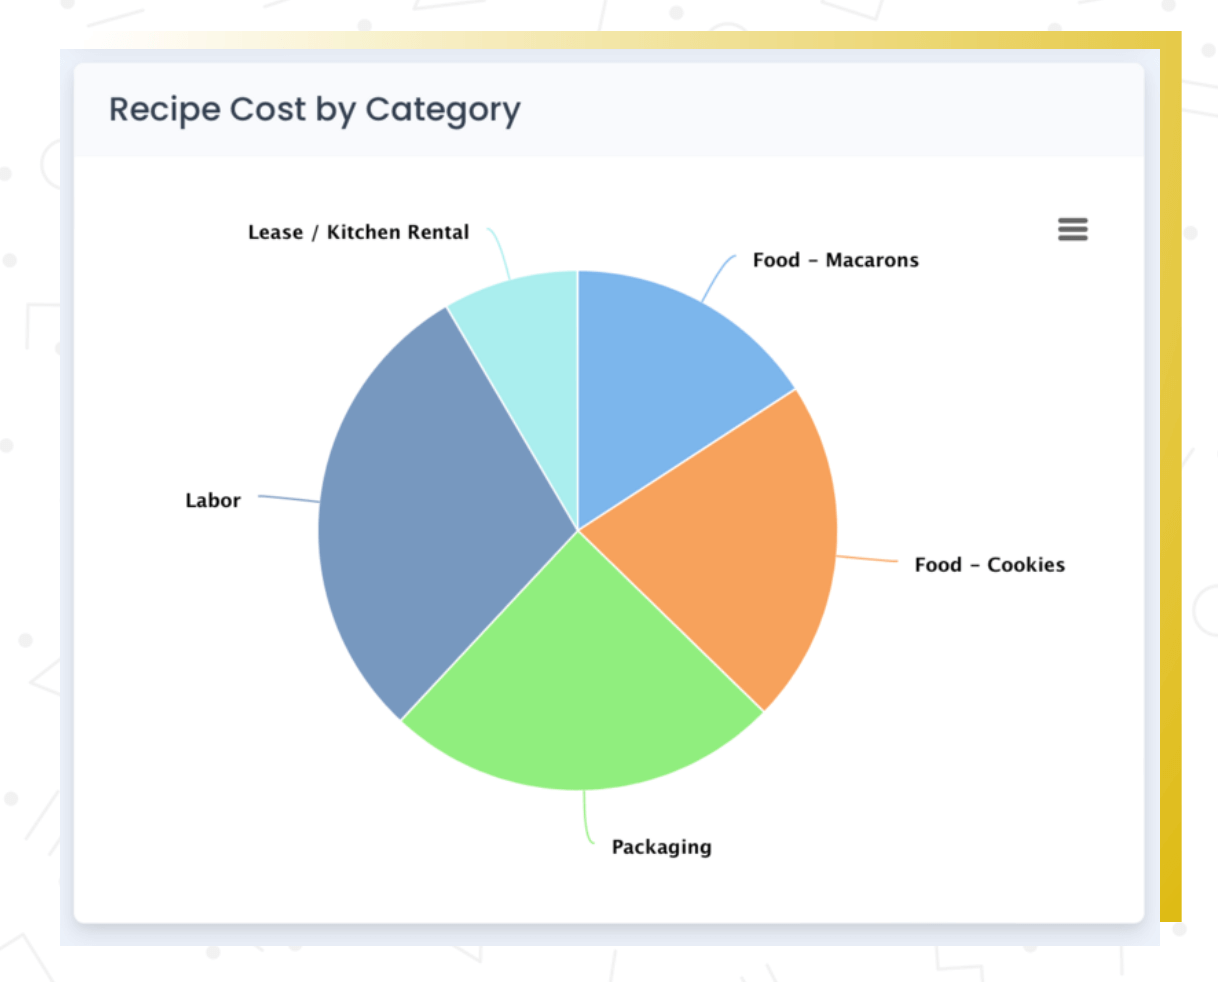
Every ingredient in Recipe Cost Calculator belongs to a category — proteins, produce, dairy, packaging, labour, whatever makes sense for your business. When you look at a recipe, you can see costs broken down by these categories, both as a list and as a chart.
This makes it easy to see where your money is going. If your protein costs are 45% of total recipe cost and your target is 35%, that's immediately visible. You can make informed decisions about substitutions, portion sizes, or pricing without digging into each ingredient individually.
What you get
Visual cost breakdown
See every recipe's costs grouped by category as a list and pie chart.
Compare across recipes
Spot which recipes are protein-heavy, packaging-intensive, or labour-driven.
Hit cost targets
See when a category exceeds its target percentage and adjust before margins slip.
How it works
Assign categories to ingredients
Set up categories that match how you think about costs — proteins, dairy, produce, packaging, labour.
Build your recipes
Add ingredients as normal. Costs are automatically grouped by category.
Read the breakdown
Open any recipe and see costs by category — percentages, dollar amounts, or a visual pie chart.
Category costing vs. guessing
| The old way | With RCC |
|---|---|
| Scroll through 20 ingredients guessing what's expensive | Pie chart shows proteins are 48% of cost |
| No way to compare cost structures across recipes | Filter and sort recipes by category cost percentages |
| Packaging cost creep goes unnoticed for months | Category trends visible at a glance on every recipe |
Category cost breakdowns are available on individual recipes and across your recipe list. You can compare category distributions across recipes to spot outliers or identify where there's room to optimize.
Why this matters
See where the money goes.
Category breakdowns turn a wall of ingredient costs into something actionable. You can quickly see if your packaging costs are creeping up, if a recipe is protein-heavy relative to its price point, or where you have the most room to reduce costs.
Frequently asked questions
See where your money actually goes
Category breakdowns are included in every plan. Start today.